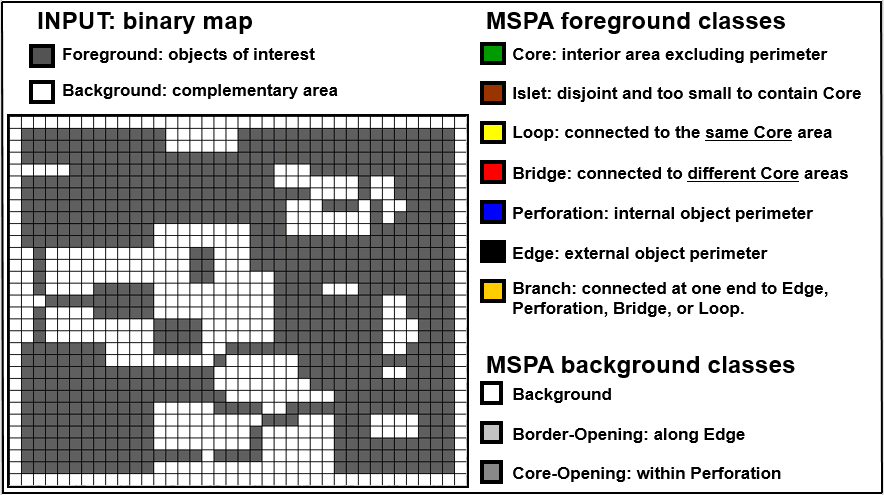
Morphology (GWB_MSPA)#
Warning
If you are considering using the MSPA module, keep in mind that the result provides
a lot of information (up to 23 classes). The alternative module GWB_SPA
provides a similar but simplified assessment with up to 6 classes only. Both modules
describe morphological features of foreground objects. Also note that while MSPA may
address certain features of fragmentation, a more comprehensive assessment of
fragmentation is obtained with the dedicated fragmentation modules GWB_FRAG.
This module conducts the Morphological Spatial Pattern Analysis. MSPA analyses shape and connectivity and conducts a segmentation of foreground (i.e. forest) objects in up to 23 morphological feature classes. The result are spatially explicit maps and tabular summary statistics. Details on the methodology and input/output options can be found in the Morphology product sheet.
Requirements#
A single band (Geo)TIFF image in data format byte:
0 byte: missing (optional)
1 byte: background
2 byte: foreground (forest)
Processing parameter options are stored in the file input/mspa-parameters.txt.
;;;;;;;;;;;;;;;;;;;;;;;;;;;;;;;;;;;;;;;;;;;;;;;;;;;;;;;;;;;;;;;;;;;;;;;;;;;;
;; GWB_MSPA parameter file:
;; NOTE: do NOT delete or add any lines in this parameter file!
;;
;; MSPA: Morphological Spatial Pattern Analysis (up to 23 classes)
;; Input image requirements: 1b-background, 2b-foreground, optional: 0b-missing
;;
;; MSPA will provide an image and summary statistics.
;; (see tools/docs/MSPA_Guide.pdf for details)
;; Please specify entries at lines 27-32 ONLY using the following options:
;;
;; line 27: MSPA parameter 1: Foreground connectivity: 8 (default) or 4
;; line 28: MSPA parameter 2: EdgeWidth: 1 (default) or larger integer values
;; line 29: MSPA parameter 3: Transition: 1 (default) or 0
;; line 30: MSPA parameter 4: IntExt: 1 (default) or 0
;; line 31: disk: 0 (default) or 1 (requires 20% less RAM but +40% processing time)
;; line 32: statistics: 0 (default) or 1 (add summary statistics)
;;
;; a parameter file with the default settings would look like this:
;; 8
;; 1
;; 1
;; 1
;; 0
;; 0
****************************************************************************
8
1
1
1
0
1
****************************************************************************
Example#
The results are stored in the directory output, one directory for each input
image accompanied by a log-file providing details on computation time and processing
success of each input image.
GWB_MSPA command and listing of results in the directory output:
$ GWB_MSPA -i=$HOME/input -o=$HOME/output
IDL 9.1.0 (linux x86_64 m64).
(c) 2024, NV5 Geospatial Solutions, Inc.

GWB_MSPA using:
dir_input= $HOME/input
dir_output= $HOME/output
% Loaded DLM: TIFF.
Done with: clc3class.tif
Done with: example.tif
Done with: gscinput.tif
MSPA processing finished sucessfully

$ ls -R output/
output/:
example_mspa  mspa.log

output/example_mspa:
example_8_1_1_1.tif  example_8_1_1_1.txt
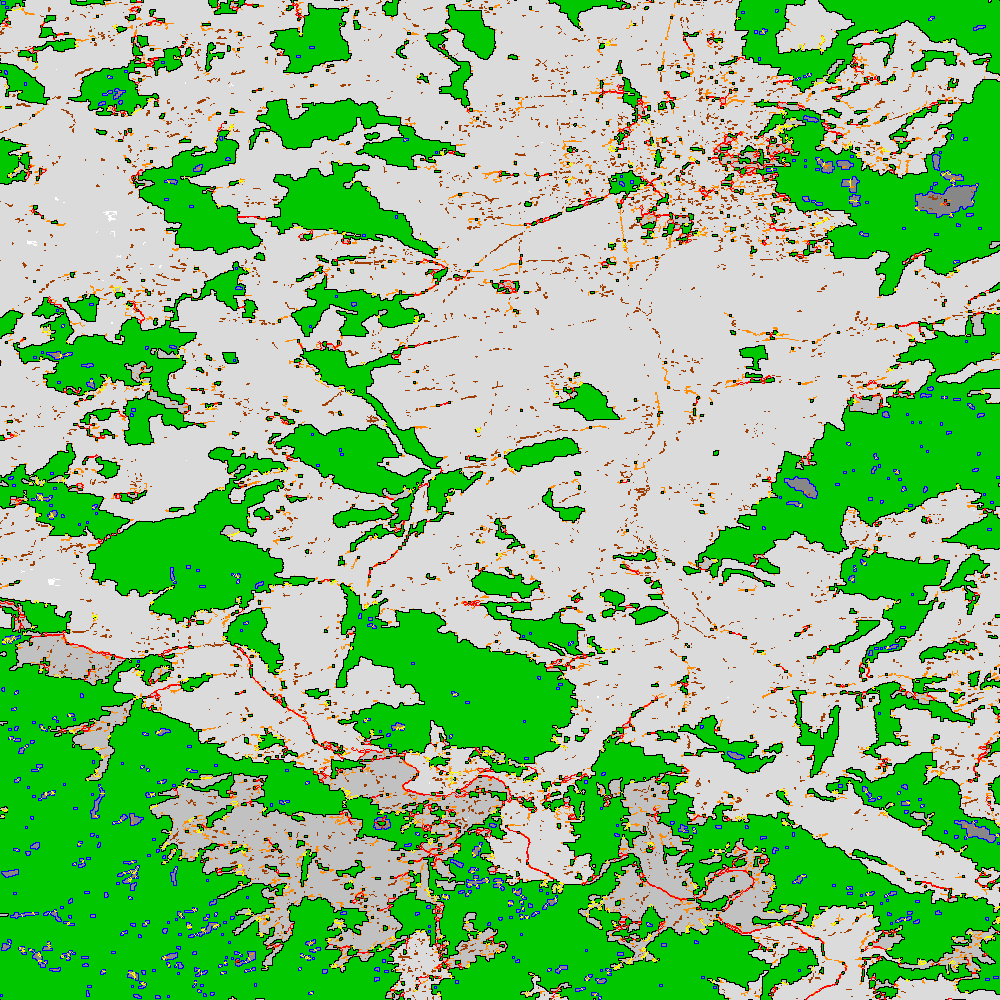
Example statistics of the input image example.tif and explanatory sketch of the
basic MSPA feature classes:
MSPA results using:
example (MSPA: 8_1_1_1, FG_area: 428490, iFG_area: 485606)

MSPA-class [color]:  FG/data pixels [%]  #/BGarea
============================================================
    CORE(s) [green]:            --/--     0
    CORE(m) [green]:      75.09/32.19     1196
    CORE(l) [green]:            --/--     0
      ISLET [brown]:       3.26/ 1.40     2429
 PERFORATION [blue]:       2.17/ 0.93     423
       EDGE [black]:      13.54/ 5.80     890
      LOOP [yellow]:       0.60/ 0.26     541
       BRIDGE [red]:       1.42/ 0.61     765
    BRANCH [orange]:       3.93/ 1.68     4685
  Background [grey]:         --/57.14     2319/571240
    Missing [white]:            0.03        51/270
     Opening [grey]:      1.50 Porosity   2291/57116
Core-Opening [darkgrey]:       --/ 0.59    717/5927
  Border-Opening [grey]:       --/ 5.12   1574/51189
Remarks#
MSPA is very versatile and can be applied to any binary map, scale and thematic layer. Please consult the MSPA Guide, the Morphology product sheet and/or the MSPA website for further information.
The simplified version,
GWB_SPAprovides fewer classes. It may be useful to get started and may be sufficient to address many assessments.
MSPA is a purely geometric analysis scheme, which can be applied to any type of raster image. It has been used in numerous peer-reviewed publications to map and summarize the spatial pattern, fragmentation and connectivity of forest and other land cover patches, including the detection of structural and functional connecting pathways, analyzing urban greenspace, landscape restoration up to classifying zooplankton species.